Midterm elections and the stockmarket: what 2018 says about 2026
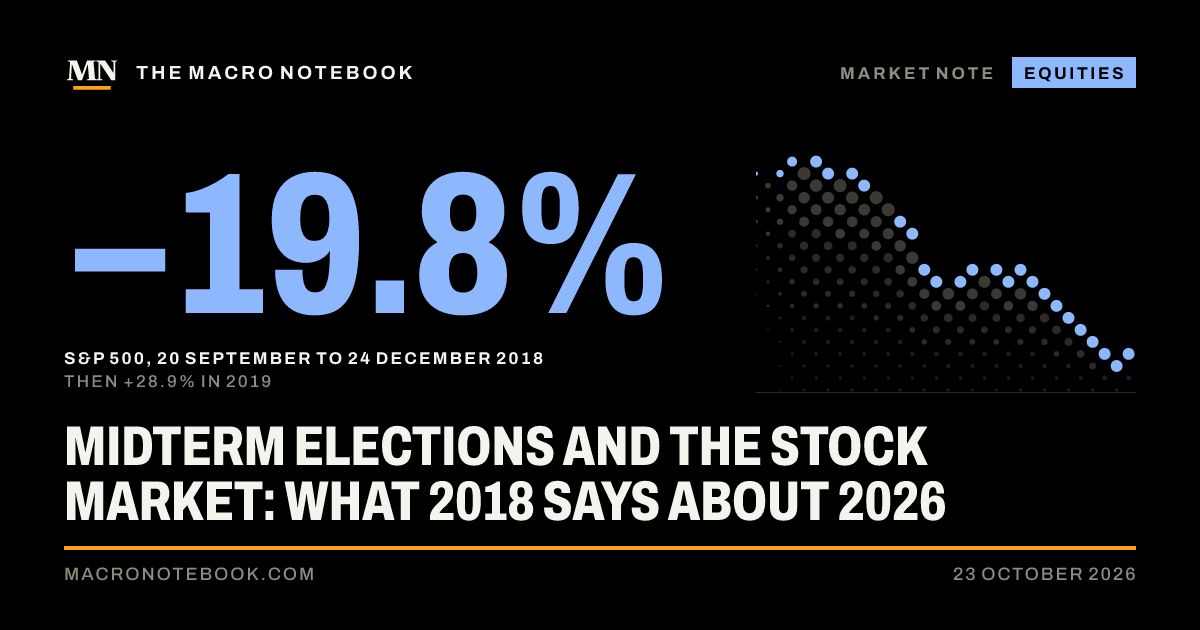
The stock market fell 19.8% around the 2018 midterm elections and rose 28.9% once the Fed turned. Now bonds pay almost what stocks earn, and rates are rising.
What do the midterm elections mean for the stock market? Investors looking for a guide before the vote on 3 November keep reaching for 2018, the last midterm with Donald Trump in the White House. Then the S&P 500 fell 19.8% from its peak on 20 September 2018 to 24 December, and rose 28.9% in 2019, by our calculation from S&P Dow Jones Indices data. The parallels with 2026 are close: a president losing popularity, profits lifted by a tax cut, a new Fed chair who wants a smaller Fed. Two differences make this year’s version riskier.
What happened to the stock market in the 2018 midterm elections
The S&P 500 closed at 2,930.75 on 20 September 2018. By the vote on 6 November it was 6% lower. Democrats won the House and Republicans kept the Senate, and the index rose 2.1% the next day. The relief did not last. The fall resumed within days and ended on 24 December, Christmas Eve, when the index lost 2.7% in a shortened session to close at 2,351.10. Over the fourth quarter it fell 14.0%.
The recovery was as fast as the fall. The S&P 500 regained its September high on 23 April 2019 and ended that year at 3,230.78, 37% above the Christmas Eve low. The election did not turn the market. The Federal Reserve did.
The Fed turned, and the market followed
In 2018 Jerome Powell, then in his first year as Fed chair, raised rates four times, the last on 19 December, to 2.25–2.50%. That day he said the Fed had put the shrinking of its balance sheet “on automatic pilot”, according to the transcript, and stocks fell further. In September 2018 the median Fed official had expected the rate to reach 3.1% by the end of 2019, the Fed’s projections show.
Then the Fed changed course. On 30 January 2019 it said it would be “patient” before moving rates again, its statement said. It cut three times that year, and by the end of 2019 the range was 1.50–1.75%, Fed data show. The rate ended 2019 about half what the Fed had expected 15 months earlier.
This Fed is raising rates, and markets want more
Kevin Warsh’s Fed raised its rate on 16 September to 3.75–4.00%, its first rise since July 2023. Officials’ median projection puts it at 4.1% at the end of 2026 and of 2027, the September projections show. Markets expect more. At the close on 22 October, futures put a 77% chance on a higher rate by the meeting of 9 December, and priced about 62 basis points of rises over the next nine meetings, according to Central Bank Watch.
The balance sheet is a slower story than in 2018. Warsh said in July that shrinking it would take years, not months, Bloomberg reported. For now the Fed’s assets are still growing: they stood at $6.75tn on 21 October, up from $6.57tn at the start of January, Fed data show. In 2018 they were already falling.
For 2018 to repeat, rate expectations would have to start falling soon. That would most likely take a shock to markets, which is what the Christmas Eve sell-off was.
Profits are growing faster than in 2018
The tax cut of 2017 lifted profits in 2018. In October that year analysts expected S&P 500 earnings to grow 20.3% over the year, FactSet reported. For 2026 they expect 32.8%, with third-quarter growth at 29.0% so far, FactSet’s latest report shows. Much of it is expected from chipmakers, as we wrote last week. Higher hopes leave more room for disappointment.
The cushion under stocks is gone
This is the larger difference. A stock’s earnings yield is its expected profit divided by its price, the inverse of the price-earnings ratio. In October 2018 the S&P 500 traded at 16.7 times expected earnings, an earnings yield of 6.0%, while the 10-year Treasury yielded 3.23%, Fed data show. Stocks offered 2.8 percentage points more than bonds.
On 16 October 2026 the index traded at 19.0 times expected earnings, an earnings yield of 5.3%, and the 10-year yielded 5.09%. The gap was 0.2 points. It widened a little on 22 October, when Treasury yields fell sharply as technology stocks sold off, as we report today. Stocks are cheaper than their five-year average of 19.8 times on FactSet’s measure, but they barely pay more than bonds.
S&P 500 earnings yield and 10-year Treasury yield, %
S&P 500 earnings yield and 10-year Treasury yield, %. Source: FactSet Earnings Insight (forward 12-month P/E of 16.7 on 5 October 2018 and 19.0 on 16 October 2026; earnings yield is its inverse); 10-year Treasury yield, Federal Reserve. Our calculation.
Earnings yield, Oct 2018
5.99
10-year yield, Oct 2018
3.23
Earnings yield, Oct 2026
5.26
10-year yield, Oct 2026
5.09
Source: FactSet Earnings Insight (forward 12-month P/E of 16.7 on 5 October 2018 and 19.0 on 16 October 2026; earnings yield is its inverse); 10-year Treasury yield, Federal Reserve. Our calculation.The Macro Notebook
The economy is also different. Brent crude cost $115.22 a barrel on 20 October 2026, against $72.68 on the eve of the 2018 vote, EIA data show. As we wrote on 5 October, the bigger risk to stocks is real yields, what bonds pay after inflation.
California’s billionaire tax is on the same ballot
One vote on 3 November could change the outlook beyond 2026. California’s Proposition 40 would charge billionaires who lived in the state on 1 January 2026 a one-time tax of 5% of their net worth, due in 2027. It would probably raise “tens of billions of dollars” over several years, but could cost the state less than $1bn a year in income tax if billionaires leave, the Legislative Analyst’s Office estimates.
It is already moving money. Meta’s board agreed this week to create non-voting shares that Mark Zuckerberg could sell to pay the tax without losing control of the company, in return for his staying in California for eight years, the Associated Press reported.
What to watch
The Fed meets on 28 October, with markets putting the odds of a rise at 8%. The vote follows on 3 November, and the Fed meets again on 9 December. If 2018 is the guide, the date that matters is not the election. It is the day the Fed signals that rates have peaked, and nothing in the market’s pricing says that day is close.
Disclosure
This is analysis and opinion, not investment advice.
WeeklyThe Notebook by email
The week, in one email
Once a week: the stories we published, and the releases and decisions due in the week ahead. Free. One click stops it.
We email you a link to confirm. By signing up, you agree to the Terms and the Privacy policy.
Check your email. We sent a link to . Open it within 15 minutes to confirm.
You are signed in as . You can change this on your Saved page.
You get the weekly email. To stop it, use the link at the end of any of them, or your Saved page.
The lek has not bought so many euros since at least 1995, when Eurostat's records begin. In September 2026 a euro cost 91.85 lek on average, the lowest monthly figure in those records. In 2019 it cost 123.01. Put the other way round, the lek now buys 33.9% more euros than it did in 2019, and 37.7% more dollars.