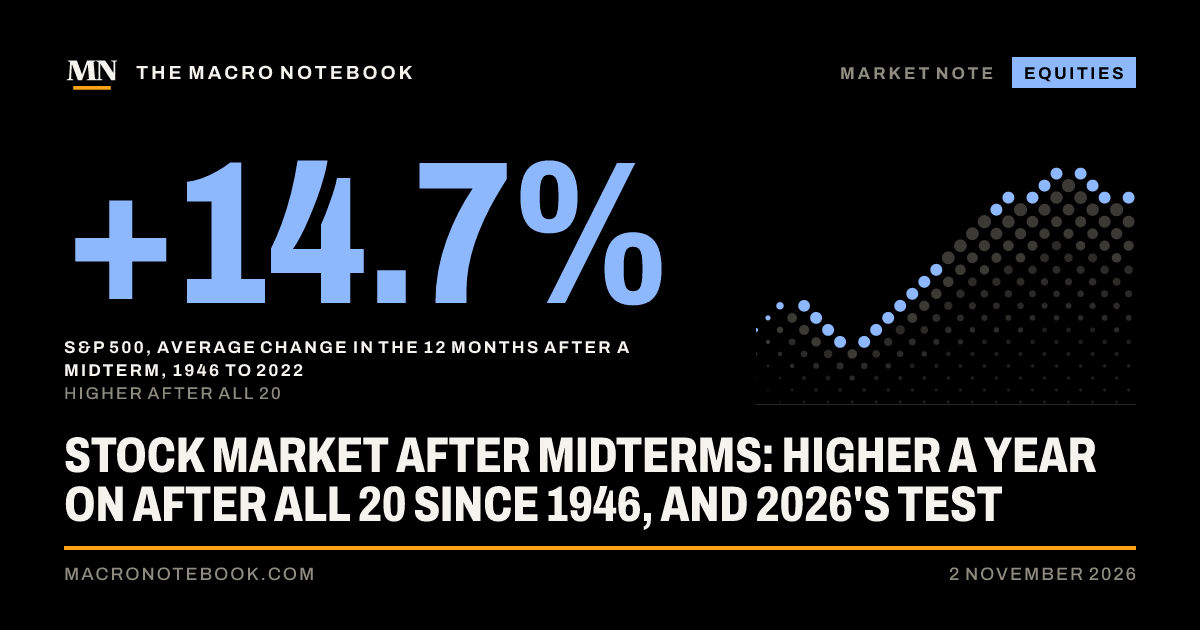
What happens to the stock market after midterms? Americans vote on Tuesday 3 November, and history gives investors a striking answer. The S&P 500 has been higher 12 months after every one of the 20 midterm elections since 1946, by 14.7% on average, by our calculation from S&P Dow Jones Indices data. In the other years, the same 12 months from early November brought 7.5% on average, and a fall almost one year in three. This year puts the record to a test it has passed before, but rarely from where markets stand now.
What the stock market did after midterms since 1946
We measured from the last close before each election to the close one year after it, price only, without dividends. All 20 periods ended higher. The median gain was about 14%, close to the average, so a few huge years do not carry the result. A study by the analyst Dave Manuel, with a slightly different end date, finds the same 20 out of 20 and an average of 14.8%.
The record is less smooth than it looks. The year after 1946 ended almost flat, up 0.1%, and the year after 1986 up about 1%. Several of the 20 held deep falls on the way: within the year after the 2018 vote, the index was at one point 14.1% below its level on election eve, and after 1974 and 2002 it fell more than 10% before it recovered. Before 1946 there were losing years, after 1930 and 1938.
The usual explanation is that a vote removes doubt. Once the result is known, investors can price the next two years of policy, and a divided Congress, which midterms often bring, makes large changes in tax and spending harder. Our view: 20 cases is a pattern, not a law. It says that the vote itself rarely sinks stocks, not that nothing else can.
Rate rises have not broken the record
The hardest test is a Fed that is raising rates, as it is now. It has happened three times.
- 1994. The Fed raised its target from 4.75% to 5.50% a week after the vote, and to 6.00% in February 1995, Fed data show. The S&P 500 still gained more than 25% in the year after the election.
- 2018. The Fed raised its range to 2.25–2.50% on 19 December, Fed data show, and stocks fell into Christmas Eve. They still ended the year after the vote 12.4% higher, from 2,738.31 to 3,076.78, S&P Dow Jones Indices data show.
- 2022. The Fed raised its range by another 1.5 points after the vote, to 5.25–5.50% by July 2023. The S&P 500 rose 15.1%.
So rate rises have dented the year after a midterm, not reversed it. In 1994 and 2018 the Fed stopped within three months of the vote; in 2022 it went on for nine.
What is different about the stock market after the 2026 midterms
Three things set this year apart, from an index that closed at 7,743.98 on 28 October, up 13.1% this year. Markets expect the Fed to keep going. After the Fed held its range at 3.75–4.00% on 28 October, as we reported that day, futures put a 72.9% chance on a rise by 9 December at the close on 30 October, Central Bank Watch calculates. Markets do not expect it to stop within months.
Bonds compete with stocks. The 10-year Treasury yielded 4.98% on 29 October, Fed data show, against 3.20% on the eve of the 2018 vote. As we wrote on 23 October, stocks now offer barely more than bonds on expected earnings. And the leaders are wobbling: the Nasdaq Composite fell 2.5% between 30 September and 29 October, Nasdaq data show, as investors sold the companies spending most on AI, the subject of our 23 October report.
What to watch
- The result, from Tuesday night. Control of the House and the Senate decides how much of the next two years’ tax and spending plans can pass.
- The Fed on 9 December. A rise is the base case. A signal that rates have peaked would matter more to stocks than the vote, as it did in 2019.
- 3 November 2027. That is when the 21st test of the record ends.