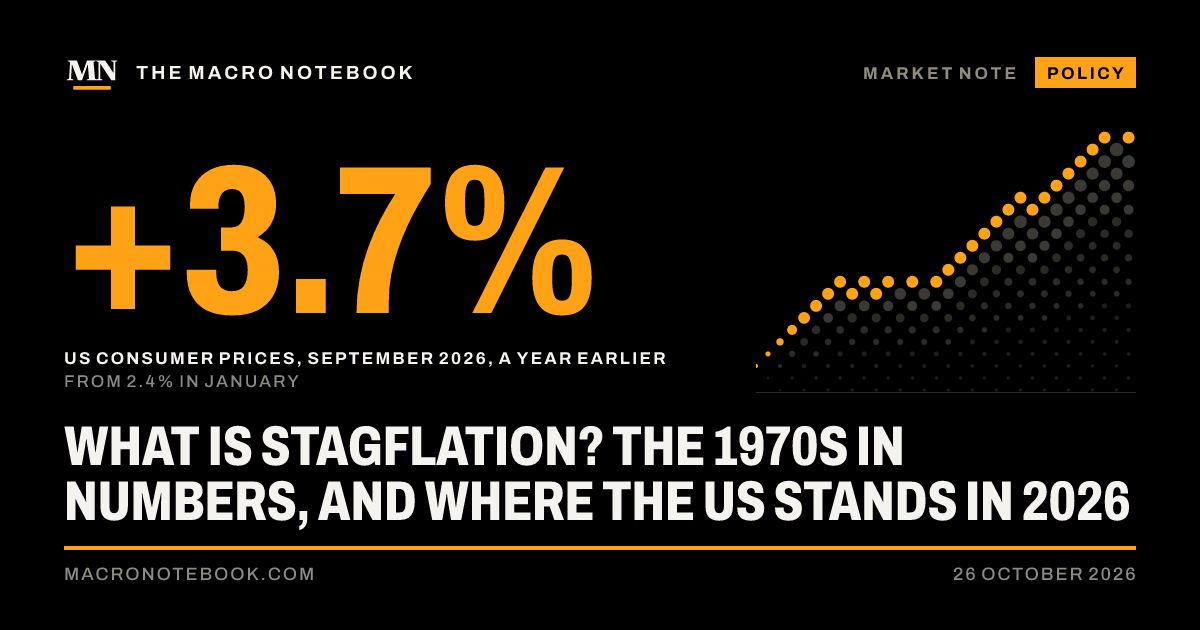
What is stagflation? The 1970s in numbers,and where the US stands in 2026
What is stagflation? High inflation with weak growth and rising unemployment. In the 1970s US prices rose 12% a year as output fell; in 2026, CPI is 3.7%.
Stagflation is high inflation and a stagnant economy at the same time: prices rise fast while output stalls and unemployment climbs. It is rare, because inflation usually comes with a strong economy, and it is hard to cure, because the usual remedy for one half makes the other worse. The US had it in the 1970s, when prices rose by more than 12% a year while output fell. In September 2026 US consumer prices were 3.7% higher than a year earlier and unemployment was 4.2%: inflation is rising, but the economy is still growing.
What does stagflation mean?
The word joins “stagnation” and “inflation”. It was coined in Britain: in a House of Commons debate on 17 November 1965, the Conservative politician Iain Macleod said the country had “a sort of ‘stagflation’ situation”, Hansard records. He meant that Britain had the worst of both: prices and wages rising, but no growth to show for it.
There is no official test, unlike a recession, which in the US is dated by a committee. Economists use the word for a mix of three things: inflation well above the central bank’s target (2% in the US, the UK and the euro area), growth near zero or below it, and unemployment that is rising. How much of each it takes is a matter of judgement, so the word is used loosely, often for a fear rather than a fact.
Stagflation in the 1970s: the numbers
The 1970s are the case everyone means. Twice, an oil shock pushed prices up just as the economy shrank.
The second came with the Iranian revolution of 1979. Inflation reached 14.8% in March 1980, the highest of the period, and GDP fell at an annual rate of 8.0% in the second quarter of 1980.
A rough gauge of the pain is the “misery index”, inflation plus the unemployment rate. On our calculation from the BLS figures, it peaked at 22.0 in June 1980. In September 2026 it was 7.9.
US misery index (inflation plus unemployment rate), peaks and September 2026
US misery index (inflation plus unemployment rate), peaks and September 2026. Source: US Bureau of Labor Statistics via FRED (CPIAUCNS, UNRATE); our calculation. Inflation is the change in consumer prices over 12 months.
Jan 1975
19.9
Jun 1980
22.0
Dec 2009
12.6
Jun 2022
12.7
Sep 2026
7.9
Source: US Bureau of Labor Statistics via FRED (CPIAUCNS, UNRATE); our calculation. Inflation is the change in consumer prices over 12 months.The Macro Notebook
The 2022 peak shows why the word needs all three parts. Inflation reached 9.1% that June, but unemployment was 3.6%, one of the lowest rates on record. Prices rose fast in a strong job market: that is inflation, not stagflation. In 2009 it was the reverse, with unemployment near 10% and inflation under 3%.
Stagflation vs recession
A recession is a broad fall in output, jobs and income; we explained how the US dates one. In most recessions inflation falls, because spending weakens and firms cut prices or raise them less.
Stagflation is a recession, or near-stagnation, in which prices keep rising anyway. That usually needs a shock to supply rather than demand: something that makes goods dearer to produce, such as a jump in the price of oil. Higher energy costs raise prices across the economy and squeeze what households can spend on everything else, so both halves come from one cause.
Why stagflation is hard to fix
A central bank fights inflation by raising interest rates, which slows spending, and fights a slump by cutting them. In stagflation the two remedies point in opposite directions. Raise rates and unemployment rises further; cut them and inflation can become entrenched as workers and firms come to expect it.
The US answer in the end was the first. The Federal Reserve under Paul Volcker raised interest rates steeply from 1979. Unemployment reached 10.8% in November and December 1982, the highest from the start of the series in 1948 until 2020. But inflation fell to 4.6% by November 1982, and from then until 2021 it never went above 6.3%.
Is the US in stagflation in 2026?
Not on the numbers so far. Inflation has turned up sharply this year: consumer prices rose 3.7% in the year to September 2026, up from 2.4% in January and February. Energy is the main reason. Brent crude, the international oil benchmark, cost $61.98 a barrel on 2 January 2026 and $115.22 on 20 October, after the war in the Gulf cut tanker traffic through the Strait of Hormuz.
But the other two parts are missing. Real GDP grew at an annual rate of 2.5% in the first quarter of 2026 and 2.2% in the second. Unemployment was 4.2% in September, up from 4.1% in August but below the 4.4% of September 2025. That is an inflation problem with a working economy, closer to 2022 than to 1974.
The risk is the 1970s order of events: an oil shock first, the slowdown later. That is why the Federal Reserve faces the dilemma above even without stagflation. The federal funds rate is 3.75% to 4%, and the Fed meets on 28 October.
The next test comes on 29 October, when the Bureau of Economic Analysis publishes its first estimate of US GDP for the third quarter, its schedule shows. A weak figure alongside 3.7% inflation would make the word harder to dismiss. The October jobs report and consumer prices follow in November. Stagflation needs all three gauges to turn at once: so far, only inflation has.
Disclosure
This is analysis and opinion, not investment advice.
WeeklyThe Notebook by email
The week, in one email
Once a week: the stories we published, and the releases and decisions due in the week ahead. Free. One click stops it.
We email you a link to confirm. By signing up, you agree to the Terms and the Privacy policy.
Check your email. We sent a link to . Open it within 15 minutes to confirm.
You are signed in as . You can change this on your Saved page.
You get the weekly email. To stop it, use the link at the end of any of them, or your Saved page.
The lek has not bought so many euros since at least 1995, when Eurostat's records begin. In September 2026 a euro cost 91.85 lek on average, the lowest monthly figure in those records. In 2019 it cost 123.01. Put the other way round, the lek now buys 33.9% more euros than it did in 2019, and 37.7% more dollars.